Investigations on the purification of Boston sewage made at the sanitary research laboratory and sewage experiment station of the Massachusetts institute of technology, with a history of the sewage-disposal problem / By C.E.A. Winslow and Earle B. Phelps.
- Winslow, C.-E. A. (Charles-Edward Amory), 1877-1957.
- Date:
- 1906
Licence: In copyright
Credit: Investigations on the purification of Boston sewage made at the sanitary research laboratory and sewage experiment station of the Massachusetts institute of technology, with a history of the sewage-disposal problem / By C.E.A. Winslow and Earle B. Phelps. Source: Wellcome Collection.
Provider: This material has been provided by London School of Hygiene & Tropical Medicine Library & Archives Service. The original may be consulted at London School of Hygiene & Tropical Medicine Library & Archives Service.
129/176 (page 123)
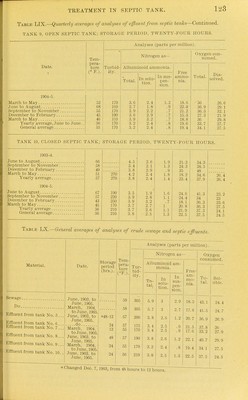
![Table LIX.—Quarterly averages of analyses of effluent from septic tanks—Continued. TANK 9, OPEN SEPTIC TANK; STORAGE PERIOD, TWENTY-FOUR HOURS. Date. 1904-5. March to May June to August September to November December to February March to May Yearly average, June to June. General average Tem- pera- ture (° F.). 52 68 55 45 46 56 55 Analyses (parts per million). ity. 170 160 170 190 leo 170 170 Nitrogen as— Albuminoid ammonia. Free ammo- nia. Total. In solu- tion. In sus- pen- sion. 3.6 2.4 1.2 18.6 2.7 1.8 .9 22.9 2.9 2.2 .7 21.2 3.6 2.9 .7 15]3 3.9 3.2 .7 18.8 3.2 2.4 .8 19.6 3.2 2.4 .8 19.4 Oxygen con- sumed. Total. 36 36.9 36.3 27.3 36 33.7 34.1 Dis- solved. 26.6 29.1 32.1 21,9 29.8 27.7 27.5 TANK 10, CLOSED SEPTIC TANK; STORAGE PERIOD, TWENTY-FOUR HOURS. 1903^. June to August September to November. December to February.. March to May Yearly average 1904-5. June to August September to November. December to February.. March to May Yearly average General average 67 57 43 45 56 56 270 270 190 220 250 170 210 210 4.5 3.4 3.8 4.2 3.8 3.5 3.9 3.9 3.7 3.7 3.8 2.6 2.1 2.9 2.4 2.4 1.9 2.8 3.2 2.7 2.6 2.5 1.9 1.3 .9 1.8 1.4 1.6 1.1 .7 1 1.1 1.3 21.3 24.3 35 18.2 23.4 24.6 24.4 18.1 20.8 21.9 22.5 34.3 38.5 48 34.6 37.9 41.3 34 36.3 36.3 37.3 37.5 26.4 26.4 23.2 23 23.6 27.5 24.1 24.5 Table hX.—General averages of analyses of crude sewage and septic efftuents. Material. Sewage Do Effluent from tank No. 5 .. Effluent from tank No. 6 Effluent from tank No. 7 .. Effluent from tank No. 8.. Effluent from tank No. 9 .. Effluent from tank No. 10. Date. June, 1903, to June, 1905. March, 1904, to June, 1905 June, 1903, to June, 1905. do March, 1904, to June, 1905, June, 1903, to Juno, 1905. March, 1904, to June, 190.'). June, 1903, to June, 1905. Storage period (hrs.). Analyses (parts per million). Tem pera ture (°F.) 148-12 24 12 48 24 24 59 58 57 57 55 - 57 55 56 Tur- bid- ity. 305 305 200 175 170 190 170 210 Nitrogen as- Albuminoid am- monia. To- tal. 5.9 5.7 3.8 3.4 3.4 3.8 3.2 3.8 In solu- tion. 3 3 2.6 2.5 2.5 2.6 2.4 9 r. In sus- pen- sion, 2,9 2,7 1.2 .9 .9 1.2 .S 1.3 a Changed Dec. 7, 1903, from 48 hours to 12 hours. Free am- mo- nia. Oxygen consumed. 18.5 17.6 20.7 21.5 17.6 22.1 19.4 22.5 To- tal. 43.1 41,5 36.9 37.8 33.2 40.7 34.1 37.5 Sol- uble. 24. 4 24.7 26.9 26 27.9 29.9 27.5 24.5](https://iiif.wellcomecollection.org/image/b21358205_0129.jp2/full/800%2C/0/default.jpg)